June 20th, 2025
Unlock Hidden Insights with Modern Data Analysis Software
By Simon Avila · 5 min read

Data is everywhere, but turning it into insight? That’s still a challenge for many teams.
According to industry research, nearly 65% of companies are now using or exploring AI-powered analytics to improve forecasting and decision-making[1]. Yet, for many knowledge workers, the process of analyzing, visualizing, and interpreting data remains slow and complex, especially without dedicated analyst support.
Modern data analysis software is changing that, making advanced analytics accessible to everyone, regardless of technical background.
The Shift Toward AI Data Analysis
How AI Data Analysis Tools Are Transforming Business
In 2025, AI and machine learning have become central to data analysis more so than ever before. They automate tedious tasks like anomaly detection, predictive modeling, and trend forecasting. So, teams can anticipate changes and respond faster[1].
Natural language processing (NLP) is also playing a key role, enabling users to interact with data using plain English instead of code. This shift is making data analysis more intuitive and opening up new possibilities for teams that lack programming expertise.
Key Benefits of AI Data Insights Platforms
• Automate repetitive data processing tasks, freeing up time for deeper analysis[1].
• Generate expert-level insights without the need for advanced technical skills.
• Enable real-time decision-making with faster data processing and visualization.
• Expand access to analytics across departments, not just IT or data science teams.
For example, a marketing manager can upload campaign data, ask questions in plain English, and receive clear visualizations and recommendations—no SQL or Python required.
How No-Code Data Analysis Is Breaking Down Barriers
Why No-Code Platforms Matter for Teams
Traditional analytics tools often require users to write code or learn complex interfaces. No-code data analysis platforms remove these barriers, letting users upload files, clean and merge datasets, and generate charts with simple commands.
This democratizes data access and empowers more people to make data-driven decisions. What once felt out of reach for most users is now available at the click of a button.
What Sets No-Code Data Analysis Platforms Apart?
• Drag-and-drop interfaces and conversational AI make analytics accessible to non-technical users.
• Built-in data cleaning and transformation tools reduce manual work.
• Integration with popular file formats (like Excel) streamlines workflows.
Julius: Conversational Analytics for Everyone
Among the no-code software, Julius stands out as a conversational analytics platform that lets users analyze and visualize data through a chat-based interface. You can upload your files, ask questions, and receive expert-level insights—all in minutes, without writing a single line of code.
This approach is especially valuable for knowledge workers who need quick answers but don’t have access to a dedicated analyst. Whether you’re a student, analyst, or decision-maker, Julius is fast, intuitive, and built for everyone.
“Natural language processing widens the range of data sources, informing strategic decisions with a richer, more nuanced understanding of market trends and customer needs.”[1]
From Raw Data to Clear Insights with Data Visualization
Best Data Visualization for Business Intelligence
Effective data visualization is needed for business intelligence. AI tools offer interactive dashboards, customizable charts, and real-time updates, helping users spot trends and outliers quickly. AI-powered platforms can even suggest the best visualization type for your data, making it easier to communicate findings to stakeholders.
Julius Data Visualization Features
• Generate graphs and charts automatically from uploaded data.
• Track key metrics and KPIs.
• Share visualizations with your team for collaborative analysis.
Example: Julius in Action
Imagine uploading a sales report and instantly seeing a dashboard with revenue trends, top-performing products, and regional breakdowns—all generated from a single command.
Comparing Modern Data Analysis Software
How Julius Compares to Other Data Analysis Tools
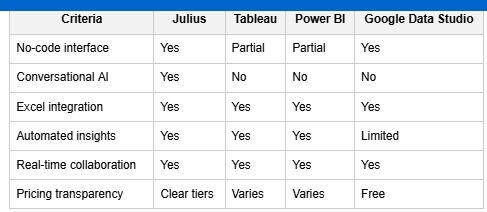
With so many options available, it’s helpful to compare key features of leading data analysis platforms. Here’s how Julius stacks up against other popular solutions:

Julius’s conversational AI and no-code approach make it especially useful for teams that want fast, expert-level insights without technical hurdles. Its Excel integration and automated data cleaning further streamline the analysis process.
Industry Trends: What’s Next for Data Analysis Software?
Emerging Technologies and Business Analytics Trends
The global big data market is projected to reach $103 billion by 2027, which is more than double its size in 2018[2]. This growth is fueled by new technologies like agentic AI, quantum computing, and immersive data visualization tools.
Agentic AI, for example, enables autonomous systems to analyze complex datasets and make independent decisions, while AR/VR tools are making data insights more accessible and engaging[2].
Top Trends Shaping Data Analysis in 2025
• AI and machine learning for advanced forecasting and automation[1].
• Natural language interfaces for easier data access[1].
• Data mesh architectures for decentralized data ownership[1].
• Edge computing for real-time analytics in IoT and industrial settings[1].
• Ethical AI and data governance to address privacy and compliance concerns[2].
Real-World Application
Retailers are using AI-powered analytics to optimize inventory, predict demand, and personalize customer experiences—all in real time.
How to Choose the Right Data Analysis Platform
What to Look for in Data Analysis Software
When evaluating data analysis tools, consider these factors:
• Ease of use: Can non-technical users get value quickly?
• Integration: Does the platform work with your existing data sources (like Excel)?
• Automation: Are routine tasks handled automatically?
• Visualization: Are dashboards and charts easy to create and share?
• Pricing: Is the cost structure transparent and scalable?
Step-by-Step: Analyzing Data with Julius
1. Upload your data file (Excel, CSV, or other supported formats).
2. Ask questions or request visualizations using plain English.
3. Review automated insights and suggested charts.
4. Customize dashboards and share results with your team.
Final Thoughts
Modern data analysis software is making it easier than ever to unlock hidden insights from your data. With platforms like Julius, you can analyze, visualize, and interpret complex datasets in minutes—no coding required.
As data continues to drive business strategy, choosing the right tool can help your team make faster, smarter decisions. If you’re ready to see how conversational analytics can work for you, try uploading your data and asking your first question today.
